Drafted with AI tools and edited by a human. The figures and conclusions were checked by a GPUniq editor.
TL;DR
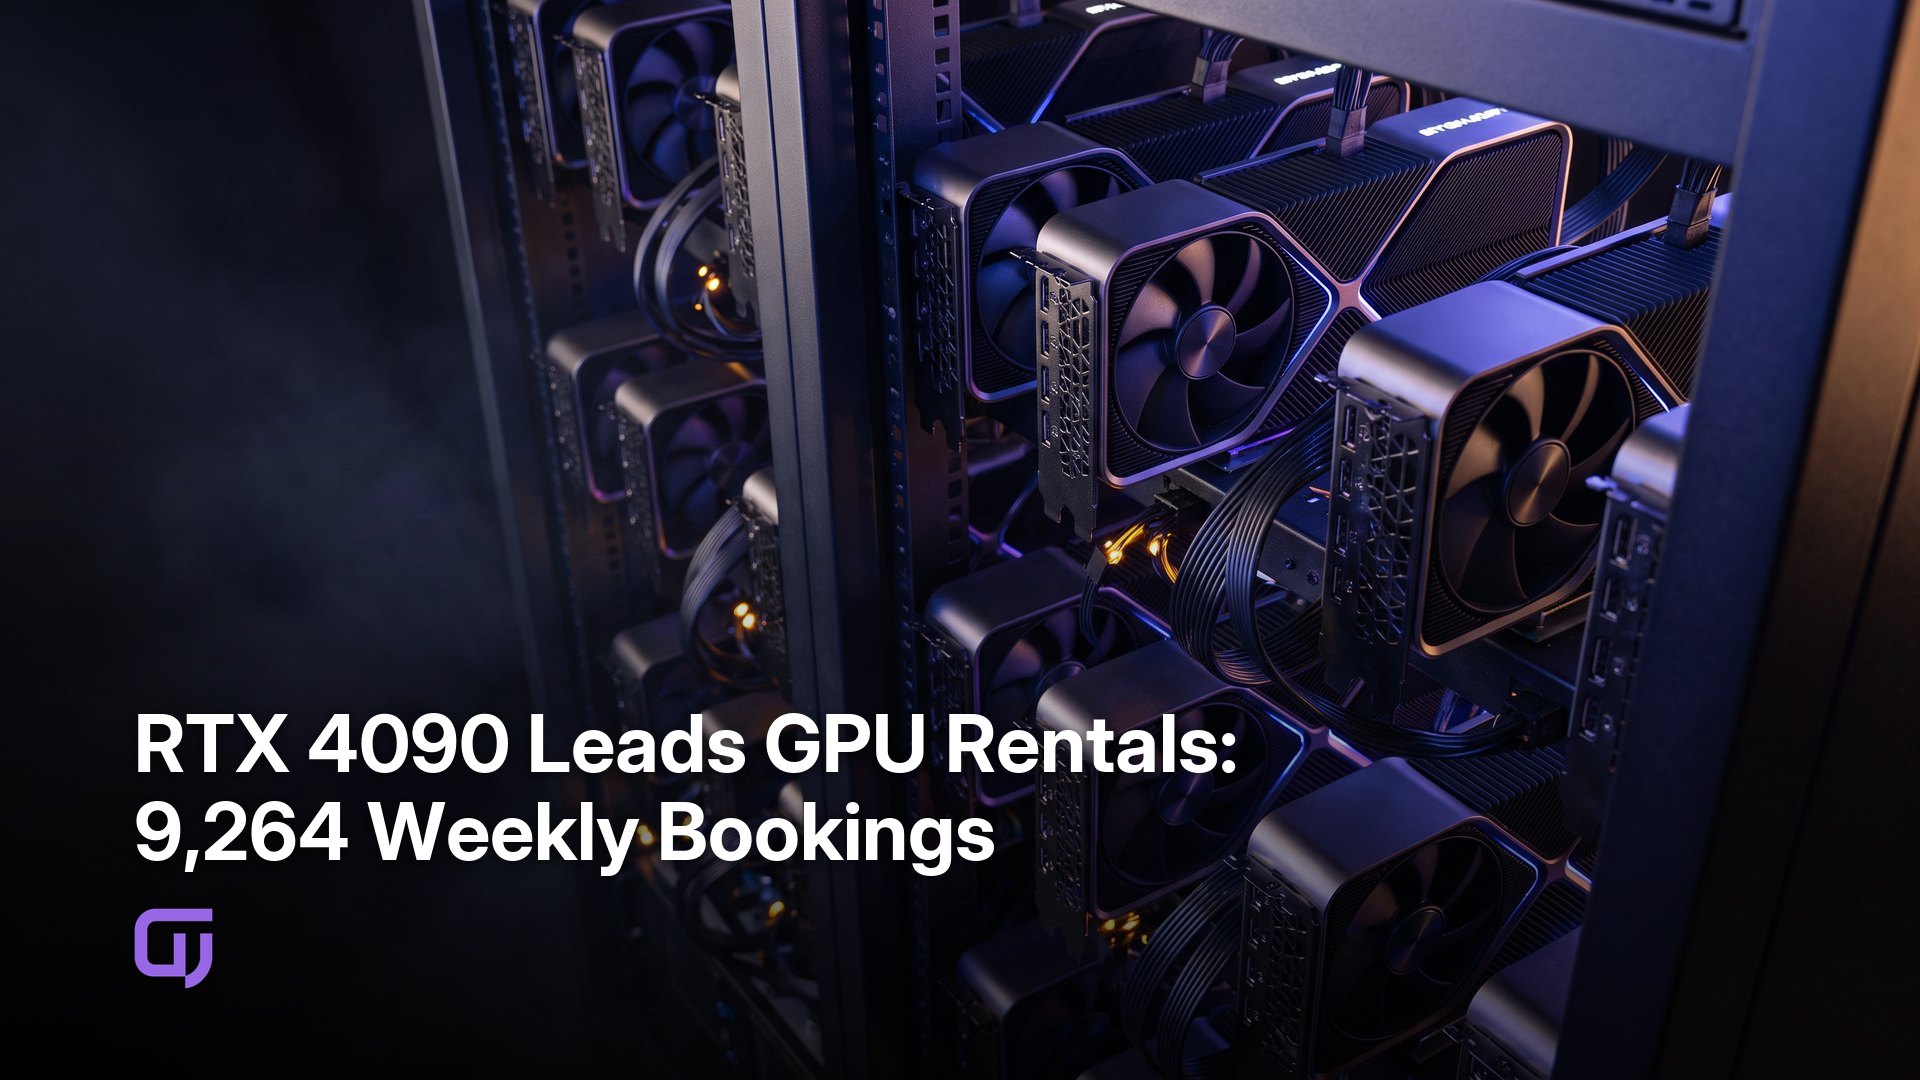
RTX 4090 led GPU rentals with 9,264 bookings over seven days at $0.607/hour, while RTX 5090 captured 8,002 rentals at $0.832/hour. GPUniq rental data shows mid-tier pricing and proven performance still outpace modern demand across the full 46,549-rental market.
Which GPUs dominate rental demand?
The RTX 4090 sits at the top with 9,264 rentals over seven days, according to GPUniq's live platform data. That's 19.9% of the 46,549 total rentals across all 12 tracked GPUs. Second place goes to the RTX 5090 at 8,002 rentals. The RTX 3090 holds third at 4,817.
Those three alone account for 22,083 rentals - 47.4% of the total. Tight concentration for a 12-model market.
The RTX 5060 Ti and A100 SXM4 round out the top five at 3,924 and 3,652 rentals respectively, serving opposite ends: cheap inference and enterprise training.
| GPU | Rentals, 7d | Price, $/hr | Market share, % |
|---|---|---|---|
| RTX 4090 | 9,264 | 0.607 | 19.9 |
| RTX 5090 | 8,002 | 0.832 | 17.2 |
| RTX 3090 | 4,817 | 0.278 | 10.3 |
| RTX 5060 Ti | 3,924 | 0.250 | 8.4 |
| A100 SXM4 | 3,652 | 1.064 | 7.8 |
| RTX 3060 | 3,214 | 0.124 | 6.9 |
| RTX PRO 6000 S | 2,502 | 1.654 | 5.4 |
Why does RTX 4090 beat RTX 5090?
The $0.225/hour gap is the most obvious factor. At $0.607 vs $0.832, the RTX 4090 is 27% cheaper per hour. For a 100-hour training run that's $22.50 saved per GPU. Teams running dozens of instances feel that immediately.
There's a useful framing: rentals per dollar per hour. RTX 4090 delivers 9,264 / 0.607 = 15,262 rentals per $/hr. RTX 5090 delivers 8,002 / 0.832 = 9,617. The 4090 generates 59% more rental volume per unit of price.
The RTX 5090 is a newer platform. Tooling, CUDA libraries, and community benchmarks for ML workloads accumulate over time, and the 4090 has had years of production use. That matters when you're debugging a training loop at 2 a.m. and need a Stack Overflow answer that actually matches your hardware.
I'd put it simply: the 4090 is the known quantity. Until the RTX 5090's ecosystem matures and prices compress, most developers will keep picking the cheaper, proven option.
How do professional GPUs compare?
The A100 SXM4 is the only enterprise card in the top five, pulling 3,652 rentals at $1.064/hour. It's the go-to for distributed training jobs where NVLink bandwidth and ECC memory matter more than hourly cost.
The RTX PRO 6000 S and RTX PRO 6000 WS sit at the opposite end of the adoption curve: 2,502 and 2,432 rentals at $1.654 and $1.737/hour respectively. Combined that's 4,934 rentals, less than the RTX 3090 alone.
| GPU | Rentals, 7d | Price, $/hr | Multiple vs RTX 4090 price |
|---|---|---|---|
| A100 SXM4 | 3,652 | 1.064 | 1.75x |
| RTX PRO 6000 S | 2,502 | 1.654 | 2.73x |
| RTX PRO 6000 WS | 2,432 | 1.737 | 2.86x |
The professional tier costs 1.75x to 2.86x the RTX 4090's hourly rate. All three cards together total 8,586 rentals, or 18.4% of the full dataset. The A100 justifies its premium for large-scale training. The PRO 6000 line is a narrower case - visualization, CAD, certified drivers - and the rental numbers reflect that niche.
Which budget GPUs offer best value?
The RTX 5060 Ti at $0.25/hour is the cheapest high-volume card in the dataset. 3,924 rentals puts it fourth overall. Rentals-per-dollar: 3,924 / 0.25 = 15,696 - slightly ahead of the RTX 4090's 15,262.
The RTX 3060 at $0.124/hour is even cheaper and still pulls 3,214 rentals. Lowest price in the dataset for a card with meaningful volume.
| GPU | Rentals, 7d | Price, $/hr | Rentals per $/hr |
|---|---|---|---|
| RTX 3060 | 3,214 | 0.124 | 25,919 |
| RTX 5060 Ti | 3,924 | 0.250 | 15,696 |
| RTX 4090 | 9,264 | 0.607 | 15,262 |
| RTX 5090 | 8,002 | 0.832 | 9,617 |
| A100 SXM4 | 3,652 | 1.064 | 3,433 |
The RTX 3060 wins on pure volume-per-dollar. For batch inference, small-model fine-tuning, or testing a pipeline before scaling up, the budget tier makes sense. The data doesn't include benchmark scores, so the performance gap isn't quantifiable here. But the pricing gap is real: $0.124/hr vs $0.607/hr is an 80% saving.
Should I upgrade from RTX 3090?
The RTX 3090 at $0.278/hour still generates 4,817 rentals a week. That's 52% of RTX 4090 volume at 46% of the price. The market hasn't abandoned it.
The RTX 4090 costs 2.18x more per hour (0.607 / 0.278 = 2.18). If it completes a given workload in less than half the time, you come out ahead on cost. If throughput scales roughly linearly with price, the two cards are cost-neutral. The data doesn't include benchmark figures, so the exact crossover isn't calculable from this dataset alone.
What the rental numbers tell you is that 9,264 developers per week have voted for the 4090 as their production choice, while 4,817 still find the 3090 worth booking. For prototyping and cost-constrained labs the 3090 is still a sensible pick. For production inference where job latency matters, the 4090's dominance in the data suggests it's the default.
What does rental demand reveal?
46,549 rentals in seven days across 12 tracked GPUs. No single card is showing the kind of extreme scarcity that would appear as a tiny rental count despite high demand.
The RTX 5000 series (RTX 5090 + RTX 5060 Ti + RTX 5070 Ti) totals 14,086 rentals. The RTX 4000 series (RTX 4090 only in this dataset) sits at 9,264. The RTX 3000 series (RTX 3090, RTX 3060, RTX 3070, RTX 3080) totals 12,490 rentals across four cards - more than the 4000 series alone. Budget and legacy hardware still drives a large slice of the market.
The RTX 5090 trails the 4090 individually by 1,262 rentals, a 13.6% gap. That's an adoption lag, not a rejection.
The Tesla V100 at $0.153/hour and 2,123 rentals is worth noting. Older enterprise silicon, priced close to the RTX 3070 and 3080, still pulling meaningful volume. Some workloads just don't need the latest hardware.
Pricing vs. demand
The inverse relationship is clear. Cheaper cards get more rentals.
The $0.124-$0.607/hour band captures the RTX 3060, RTX 3070, RTX 3080, Tesla V100, RTX 5060 Ti, RTX 3090, and RTX 4090 - seven cards totaling 27,801 rentals, or 59.7% of the full dataset.
| Price tier, $/hr | Cards | Total rentals | Share, % |
|---|---|---|---|
| 0.10 - 0.30 | RTX 3060, RTX 3070, RTX 3080, Tesla V100, RTX 5060 Ti, RTX 3090 | 18,537 | 39.8 |
| 0.31 - 0.65 | RTX 5070 Ti, RTX 4090 | 11,424 | 24.5 |
| 0.66 - 1.10 | RTX 5090, A100 SXM4 | 11,654 | 25.0 |
| 1.11 - 1.74 | RTX PRO 6000 S, RTX PRO 6000 WS | 4,934 | 10.6 |
Sub-$0.65/hr cards account for 64.4% of all rentals. Above $1.10/hr you're in a specialist tier that serves real use cases but at a fraction of the volume. I'd start any cost-sensitive project in the $0.10-$0.65 band and only move up when a specific workload demands it.
Market concentration risk
All 12 tracked GPUs are NVIDIA silicon. With no AMD or Intel GPU presence in the rental volume figures at all. That's a single-vendor dependency across 46,549 weekly rentals. Any supply disruption in NVIDIA's production chain hits every tier simultaneously.
The top three GPUs (RTX 4090, RTX 5090, RTX 3090) account for 47.4% of rentals. The RTX 4090 alone at 19.9% market share is a single point of concentration no other card comes close to matching.
The professional tier (A100 SXM4, RTX PRO 6000 S, RTX PRO 6000 WS) totals 8,586 rentals, or 18.4% of the dataset. Most workloads are running on consumer-grade hardware without certified drivers, ECC guarantees, or enterprise SLAs. For inference that's usually fine. For regulated or production-critical training jobs, the concentration in consumer cards is worth thinking about.
Related on the GPUniq blog
Methodology
Rental counts are actual rentals recorded on GPUniq over the last seven days. 'Minutes to rent' is the median time an offer for that card stayed listed before someone took it — a low number means the card is scarce, not that it is cheap.
Sources
- 1.GPUniq GPU statistics — GPUniq (accessed )
Want cheap GPUs for your next project?
Browse live GPU prices and rent the right card in seconds — H100, A100, RTX 4090, and 50+ more models.