Drafted with AI tools and edited by a human. The figures and conclusions were checked by a GPUniq editor.
TL;DR
RTX 4090 rental prices surged 113.5% in 30 days to a median of $1.01/hour. RTX 5090 climbed 55% to $1.15/hour. Both are the steepest gains since Q2 2026, driven by 80-100% use across premium consumer and data center GPUs. The GPUniq GPU Rental Price Index (September 21, 2026) tracks 98 GPU models across 6,817 units. The RTX 4080 Super has zero available offers at 100% use. The full market spans an 87x price range: $0.08 to $7.01/hour.
Biggest price jumps
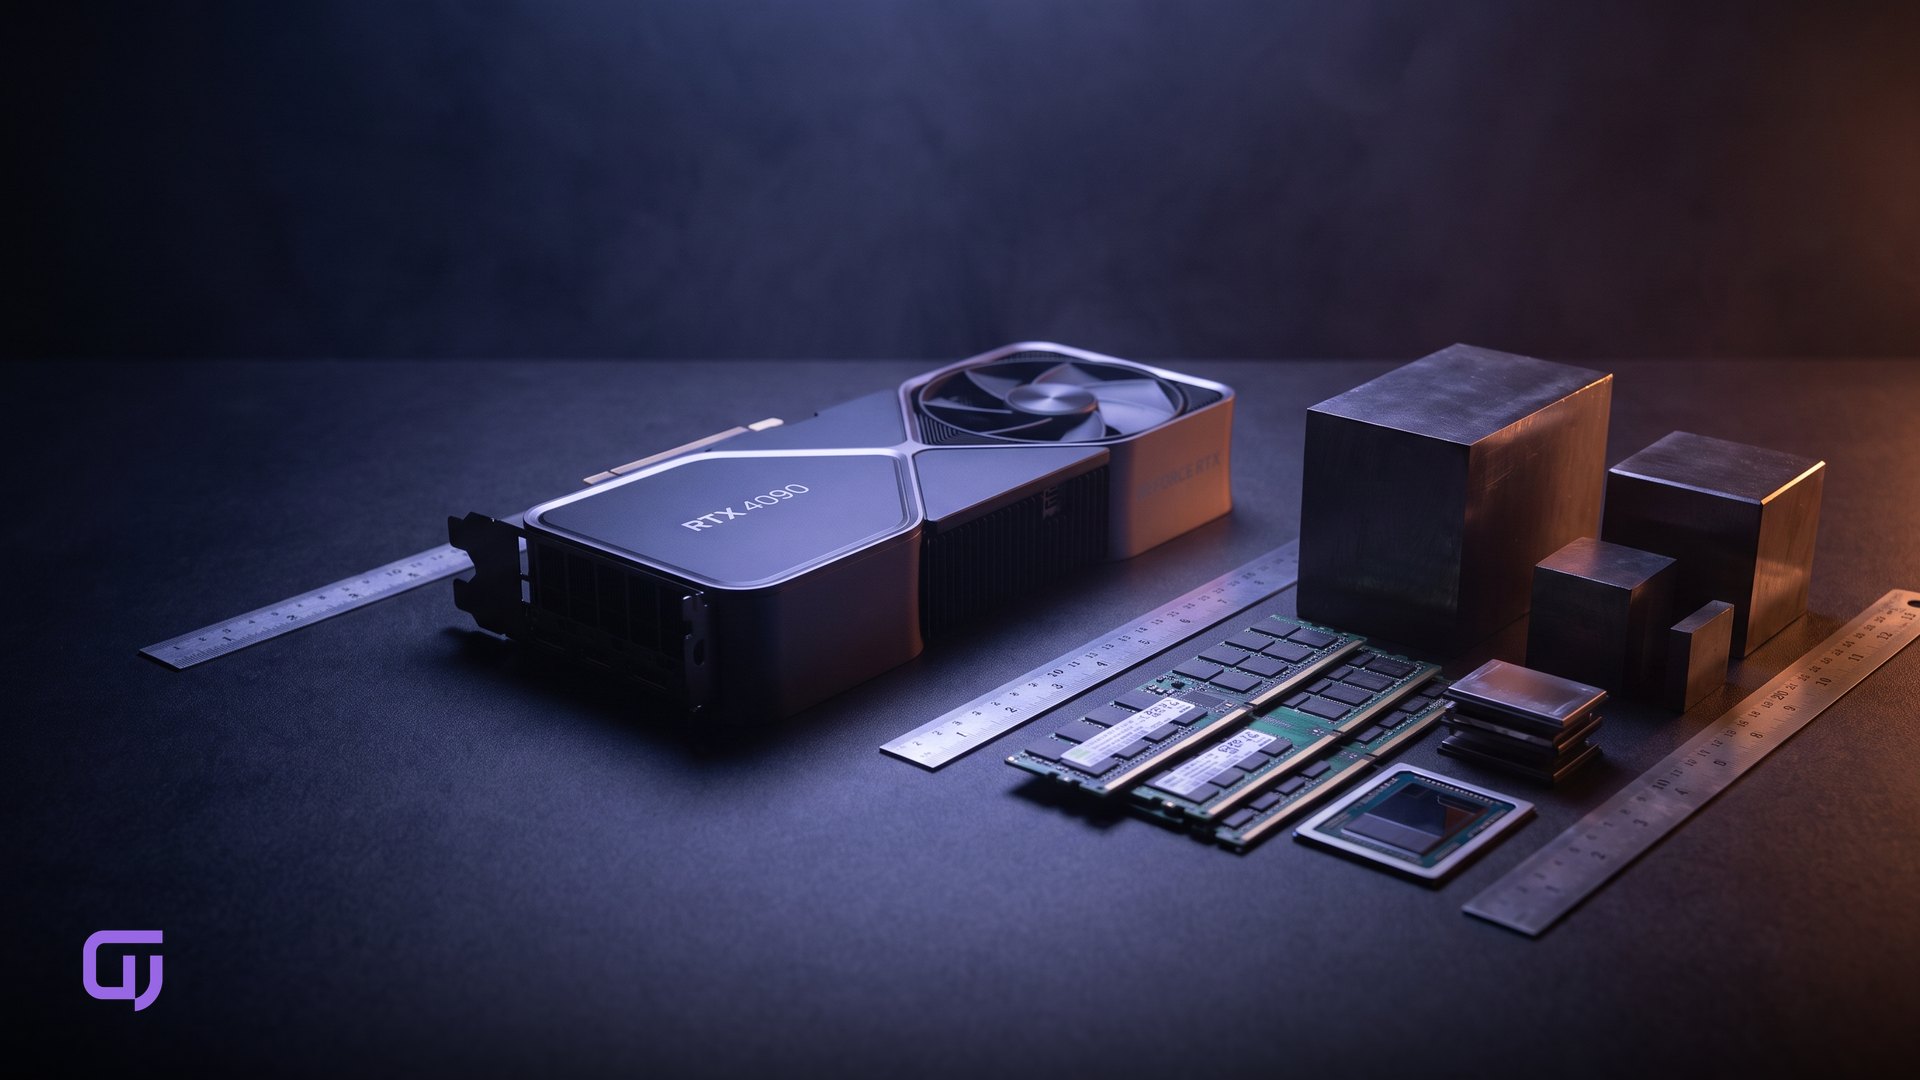
The RTX 4090 is the headline: +113.5% in 30 days, landing at a median of $1.01/hour. Largest single-model spike in the current GPUniq dataset.
RTX 3090 is close behind at +95.5%. Still only $0.30/hour median, so the absolute move is small, but the percentage signals that older-generation hardware is getting swept into the same demand wave. That surprised us.
The A100 is the one outlier going the other direction. Down 10% to $1.64/hour despite 90% use. High use normally pushes prices up. The most likely explanation: enterprise contracts are absorbing A100 capacity at fixed rates, so the spot market is shrinking rather than repricing upward.
Full picture for the most-tracked models, GPUniq data September 21, 2026:
| GPU | Median $/hr | Min $/hr | 30d Change % | Use % | Available Offers |
|---|---|---|---|---|---|
| RTX 4080 Super | n/a | n/a | n/a | 100 | 0 |
| H200 | 7.01 | 4.97 | n/a | 90 | 45 |
| H100 | 4.37 | 2.61 | n/a | 80 | 61 |
| RTX PRO 6000 Max-Q | 2.41 | 1.61 | n/a | 90 | 18 |
| RTX PRO 6000 | 2.31 | 1.66 | +13.4 | 80 | 141 |
| A100 | 1.64 | 0.60 | -10.0 | 90 | 76 |
| RTX 5090 | 1.15 | 0.60 | +55.0 | 60 | 585 |
| RTX 4090 | 1.01 | 0.60 | +113.5 | 80 | 244 |
| RTX 3090 | 0.30 | 0.19 | +95.5 | 90 | 75 |
| RTX 5060 Ti | 0.25 | 0.19 | +37.6 | 90 | 48 |
| RTX A4000 | 0.16 | 0.13 | n/a | 80 | 52 |
| RTX 3060 | 0.10 | 0.08 | n/a | 80 | 105 |
Cheapest GPU available now
RTX 3060 starts at $0.08/hour, median $0.10/hour. That's the floor across all 98 models. 105 active offers, 80% use - not trivially available, but far from sold out.
RTX A4000 is the next step at $0.13-$0.16/hour. Useful for inference workloads that need more VRAM than the 3060 without jumping to the $1.00+ tier.
The budget tier ($0.08 to $0.30/hour) runs at 60-80% use. That headroom matters: you can actually find capacity when you need it, which you cannot say about anything at 80-100% use right now.
If cost is the primary constraint and you're running baseline inference or light fine-tuning, the RTX 3060 at $0.10/hour is the honest answer. The 3090 at $0.30/hour is a better GPU, but the +95.5% move in 30 days suggests that gap is closing faster than expected.
How scarce are premium GPUs?
The RTX 4080 Super tells the whole story: 100% use, zero available offers, 219 units tracked. Complete stockout.
H200 is close behind. 90% use, only 45 offers across 353 tracked units, $7.01/hour median. Nearly gone.
RTX 5090 is actually the most available premium GPU right now. 585 active offers out of 1,632 tracked units, 60% use. If you need serious compute and want optionality, that's where supply exists.
The pattern is consistent: scarcity drives price, but not always predictably. The RTX 4090 is older than the 5090 and cheaper per hour, yet gained more in 30 days because its use is tighter (80% vs. 60%) and its available pool is smaller (244 offers vs. 585).
Why did RTX 4090 outpace RTX 5090 in gains?
Three things working together.
Supply. The RTX 4090 hit 80% use against 244 available offers. The RTX 5090 sits at 60% with 585 offers. Tighter inventory means any demand spike hits price harder and faster.
Production lock-in. Models and pipelines trained on RTX 4090 hardware don't migrate easily. If your inference stack is tuned for 4090 memory layout and CUDA characteristics, you keep renting 4090s. That sticky demand compresses the available pool even when the 5090 is technically superior.
Floor collapse and recovery. The 4090 price floor dropped in August 2026 and is now recovering. A floor collapse followed by recovery produces outsized percentage gains even if the absolute price stays below the 5090. Going from $0.47/hour to $1.01/hour is +115%. Going from $0.74/hour to $1.15/hour is +55%. The 5090 never had the same floor collapse, so its recovery looks smaller in percentage terms.
The generational cost ladder is also worth noting: RTX 3090 at $0.30/hour, RTX 4090 at $1.01/hour, RTX 5090 at $1.15/hour. The 3090-to-4090 jump is 3.4x the hourly cost. The 4090-to-5090 step is only 14%. That compression at the top is new.
H100 vs. RTX 5090 for inference cost
Per hour, the RTX 5090 at $1.15/hour is roughly 3.8x cheaper than the H100 at $4.37/hour.
But hourly rate is not the same as cost per inference. The H100 has faster memory bandwidth, NVLink for multi-GPU scaling, and MIG partitioning for multi-tenant workloads. For single-tenant batch inference on a model that fits in 24 GB, the RTX 5090 wins on cost. For real-time serving handling dozens of concurrent requests across multiple GPUs, the H100's architecture earns back some of that premium.
The practical split:
- Batch inference, single model, latency-tolerant: RTX 5090 at $1.15/hour
- Real-time serving, multi-tenant, latency-sensitive: H100 at $4.37/hour or H200 at $7.01/hour
- Budget batch inference where the model fits in 24 GB VRAM: RTX 3090 at $0.30/hour
One thing the data made clear: the H100 minimum is $2.61/hour. The cheapest H100 offer is 2.3x the RTX 5090 median. There's no overlap in the price ranges. If your workload runs on consumer hardware, the decision is straightforward.
What's driving the volatility?
September is historically peak demand for GPU rentals. Teams that need fine-tuned models ready for Q4 are running training now. That's not speculation - it shows up in use data every year around this time.
The use picture from GPUniq is stark. RTX 4080 Super at 100%, H200 at 90%, A100 at 90%, RTX 3090 at 90%, RTX 5060 Ti at 90%. Five different GPU classes above 85% simultaneously points to structural pressure, not a single-model squeeze.
6,817 total units across 98 models sounds like a lot. It isn't. The RTX 4080 Super is 219 units total. The H200 is 353 units. These are thin markets where a few hundred additional rental requests can move use from 70% to 100% in days.
Provider lock-in compounds this. Older GPU models held by long-running production workloads don't return to the rental pool between jobs. The RTX 3090 at 90% use with only 75 available offers is a good example: most of those 647 tracked units are committed to existing tenants.
How to lock in stable GPU rates
Avoid anything at 90-100% use if you need predictable pricing. The RTX 4080 Super has zero offers. A100, H200, and RTX 3090 are all at 90%. There's no negotiating position in those markets right now.
The RTX 5090 at 60% use and 585 active offers is the most defensible choice for premium compute. Prices are up 55% in 30 days, but the use headroom means less pressure for another spike in the near term compared to the 4090.
For baseline workloads - data preprocessing, small model inference, batch jobs that aren't latency-sensitive - the RTX 3060 at $0.10/hour on a 30-day contract is the cheapest way to lock in capacity. 105 active offers at 80% use means you can actually get it.
Concrete steps:
1. Identify workloads under 12 GB VRAM and shift them to RTX 3060 or A4000.
2. For anything needing 24 GB+, book RTX 5090 now while utilization is at 60%.
3. Avoid spot pricing on RTX 4090 and RTX 4080 Super until utilization drops below 75%.
4. Check the GPUniq index daily through September - the 30-day change numbers are moving fast enough that a week of delay changes the math.
The RTX 4090 move from roughly $0.47 to $1.01/hour happened fast enough that anyone not watching the index paid double without knowing it was coming.
Median hourly rate across all GPUs
Full range: $0.08/hour (RTX 3060) to $7.01/hour (H200). That's an 87x spread across 98 models.
Most of the distribution sits in the consumer GPU range. The RTX 5090 at $1.15/hour is a reasonable mid-market reference for cost-performance. Below that you're trading compute for savings. Above that you're paying for enterprise features, memory bandwidth, or multi-GPU fabric.
Enterprise outliers - H200 and A100 class - represent under 5% of rental offers but dominate headlines because the absolute dollar amounts are large. Eight H200s for a week is over $9,000. That's not a budget most teams authorize without a specific justification.
The cheap end is still cheap. The middle is getting expensive fast. The top is either sold out or priced for teams with serious budgets. If you're running real training workloads but not at hyperscaler scale, the RTX 5090 at $1.15/hour is probably where you land - and locking that in before use climbs past 70% is the move.
Methodology
Prices are the minimum and the median hourly rate across GPUniq offers that were rentable at the moment of the snapshot, per GPU (an eight-card host counts as eight). Retail rates, platform margin included. The 30-day change compares the first and last daily median in the window.
Sources
- 1.GPUniq GPU price index — GPUniq (accessed )
Want cheap GPUs for your next project?
Browse live GPU prices and rent the right card in seconds — H100, A100, RTX 4090, and 50+ more models.